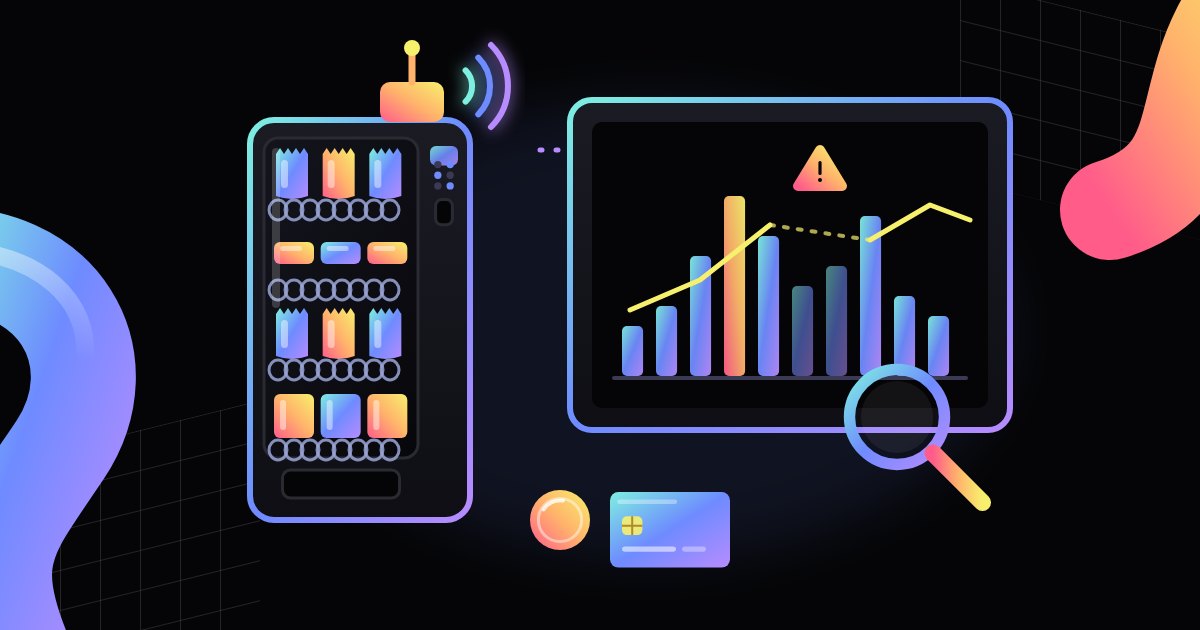
Where a vending machine's sales report comes from, what a dashboard usually shows, how to read trends in sales data, when a report can mislead, and what to check before choosing a system.
A vending machine with a telemetry module records every sale, and the operator dashboard turns that data into a sales report. On screen, you see a table or a chart, but the numbers come from specific sources: the controller's counters, the DEX record, and transactions from the payment reader. In this article, we explain where sales data comes from, what a report usually shows, how to read trends without guessing, when the data can be misleading, and what to check before choosing a dashboard. For a general introduction, see our article on vending telemetry.
Where a report comes from: telemetry, DEX, and payments
A sales report is not created out of nothing in the dashboard. The dashboard collects, organizes, and displays data that the machine and the payment devices recorded earlier. There are usually three sources:
- The machine controller – counts vends from each spiral, column, or menu item and records the prices at which products were sold.
- The DEX/UCS record – a standard format in which the machine shares its sales counters, amounts, and events. The telemetry module can read it regularly and pass it on. We cover this format in more detail in DEX/UCS – how a vending machine shares its sales data.
- The cashless payment reader – records transactions made by card, phone, or watch. Reader data often goes to a separate system run by the payment provider, and the operator dashboard can pull it in and combine it with sales from the machine.
The telemetry module sends the data to a server over a cellular network or another connection. Some systems report each transaction almost immediately, while others collect data and send it in batches at intervals. This affects how current the report in your dashboard is.
Keep in mind that cash and cashless payments may be counted in different places. The controller knows how many coins and bills it accepted, and the reader knows how many card transactions it approved. The report combines these streams into one picture, but if one of the sources has not sent its data, the total may be incomplete.
What a report usually shows: units, revenue, hours, and stock-outs
The layout depends on the system, but most dashboards show a similar set of information:
- Units sold – how many times a product was vended from a given slot in the selected period.
- Revenue – the value of sales, often split into cash and cashless payments.
- Sales by product – which items sell most often and which sell rarely.
- Sales over time – sales by hour, day of the week, or week by week.
- Stock and stock-outs – the estimated number of items in each slot and a list of slots that are empty or nearly empty.
- Events – failed vends, declined payments, door openings, or connection drops.
Stock levels inside the machine are usually not measured directly. The system takes the number of items entered at the last restock and subtracts sales from it. That means the stock figure in the report is only as accurate as the record of the last restock. If a service technician added products but did not log it in the system, the report may show stock-outs that don't actually exist.
Many dashboards let you filter a report by machine, location, product, or period and export the data to a spreadsheet. This is useful when you want to compare several machines or prepare a summary for the host site.
How to read trends without guessing
A single day tells you very little. Sales at a vending machine depend on foot traffic at the location, the weather, public holidays, vacations, and events in the building. That is why trends are better judged over a longer stretch, comparing similar periods, such as week over week or the same weekday across several weeks.
A few rules help you read sales data reliably:
- Compare like with like – Monday with Monday, a full week with a full week, the same machine before and after a change.
- Look at units and revenue separately – higher revenue may come from a price change rather than from more products sold.
- Check availability – a product that was out of stock for several days will sell less, not because customers don't want it, but because it wasn't there.
- Keep notes on changes – a new product, a price change, moving the machine, or renovation work in the building. Without such notes, it is hard to explain a jump on the chart later.
- Don't draw conclusions from small numbers – a difference of a few units a week on a slow-selling product is often chance, not a trend.
The hourly breakdown is useful for planning restocks. If most sales happen around lunchtime, the machine should be full before the lunch break, not after it. Sales by product, in turn, help you judge whether the slot layout matches what customers actually buy.
Alerts and data gaps – when a report can mislead
A report shows what reached the server. If data did not arrive or was recorded incorrectly, the chart still looks fine but describes reality only in part. Typical situations include:
- Connection drops – the modem lost signal or the module was switched off. Some systems send the backlog once the connection is restored, while others show a gap.
- Power outages – the machine could not sell during that time, so a dip on the chart does not mean lower interest.
- Failed vends – the payment went through, but the product did not drop. Depending on the settings, such a transaction may be refunded, retried, or logged as an event to review.
- An outdated planogram in the system – if the dashboard assigns a different product to a slot than the one actually in the machine, the report will credit sales to the wrong product.
- Service tests – test vends after a repair or a product change may end up in the counters if they were not marked as service vends.
- Different end-of-day cutoffs – if the machine, the reader, and the dashboard close the day at different times, evening sales may land on different days in different summaries.
That is why it pays to read the report together with the event log. An alert about a lost connection, an open door, or a vend error often explains an unusual result. We cover the signals a machine sends in our article on vending machine alerts.
It is also good practice to check the report against reality from time to time: against the cash collected from the machine, the settlement from the payment provider, and the number of products added during restocking. If the differences keep coming back, the cause may be a system setting rather than the sales themselves.
What to check before choosing a dashboard
Sales reporting systems differ in the range of data, ease of use, and pricing. Before you choose one, it is worth asking the provider a few questions:
- which sources the system pulls data from (controller, DEX, payment reader) and whether it works with the machines you already have,
- how often data reaches the dashboard and what happens to it during a connection drop,
- whether the report separates cash and cashless payments and whether it can be matched against the payment provider's settlement,
- which filters and views are available: machine, location, product, hour, period,
- whether the data can be exported to a spreadsheet or another system, and in what format,
- how permissions are set up, meaning who can see which machines and which reports,
- how the system flags data gaps, service tests, and events that may distort the results.
It makes sense to limit access to sales data to the people who actually need it. It is also a good idea to agree with the provider on where the data is stored and for how long.
When you look at modern vending machines (the publisher's website), check whether a given model has a telemetry module or can be fitted with one, and what data it makes available for reports.
Summary
A telemetry sales report combines data from the machine controller, the DEX record, and the payment reader. It shows units sold, revenue, sales over time, stock levels, and events. To read it reliably, compare similar periods, look at units and revenue separately, check product availability, and keep notes on changes. Connection gaps, failed vends, or an outdated planogram can distort the picture, so the report is best read together with the event log and checked against reality from time to time.
FAQ
How is a telemetry sales report different from a DEX read? A DEX read is a record of the machine's counters in a standard format. A dashboard report uses such reads, but it can combine them with payment reader data, stock levels, and events and display everything as tables and charts.
How often is the report updated? It depends on the system and its settings. Some modules send data after every transaction, others at intervals. The system provider can give you the details.
Why doesn't the stock in the report match what is in the machine? Most often because stock is calculated: sales are subtracted from the number entered when the machine was last restocked. Restocking that was not logged, test vends, or an outdated planogram in the system causes differences.
Does the report show cash sales? Usually, yes, if the controller passes cash data to the telemetry module. Still, it is worth comparing the amounts in the report with the cash actually collected from the machine from time to time.
Can a report tell me what to change in the product range? A report shows what sells and when, but decisions are better made over a longer period, taking into account stock-outs, price changes, and events at the location.